The last blog post on our networth update was in Feb 2021. Its been a while between drinks therefore here is the latest update.
I do not track visitors and/or repeat visitors to this blog therefore I do not know if this blog has any repeat visitors. Assuming the worst case scenario that is there are no repeat visitors, lets re-cap what is networth and how is it calculated. Networth is sum of your assets (excluding debts) at any given point in time.
Networth = Total value of assets – Total value of debts
The index is quite simple, networth as of first date of record keeping is considered as a reference or baseline for the rest of the series. If x is the net-worth as of first date of record keeping, then networth index as of today NW = y / x , where y = networth as of that month.
This is our latest networth index chart.
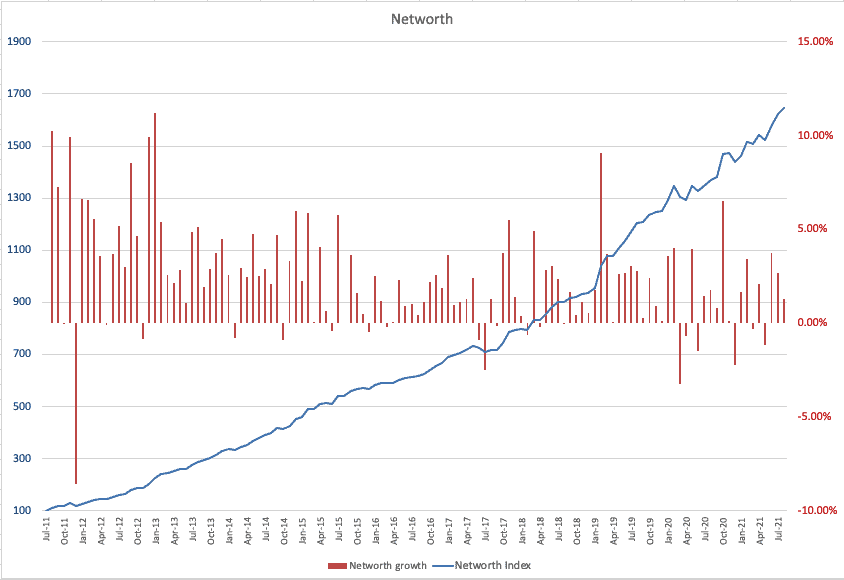
Compounded annual growth of our networth is approximately around 1545%. Considering that we started keeping track of our networth circa July 2011, we have crossed a significant time milestone of 10 years! Bit over a 10 years and a month. I am quite satisfied with how we are tracking towards our goal. What goal? I will revisit this point a bit later in this blog.
In my last update, I have alluded to the fact that we will be starting a small business sometime this year. We setup the business and hit some roadblocks straightaway in terms of breaking through the industry barriers. We realised we will need to hire specialist consultants to make in-roads into the industry. Which meant this has to be on a slow burn as we do not have a bags of cash floating around to bring in an army of consultants. Therefore, we will have to pivot to something else for the short term whilst we build relationships with the consultants. To what do we pivot to? No idea yet.
I have also opened a Vanguard personal account to siphon small amounts regularly (fortnightly) into a bucket of four Vanguard products. The four products are $VGE, $VBLD, $VVLU and $VISM. The weighting is heavily skewed towards $VBLD (Global Infrastructure ETF) at this point. My strategy for this account is purely Buy-Hold and rebalance once a year or infrequently. I intend to hand over this account to my partner and get her comfortable with ‘trading’ aka buying.
In my trading account, it’s not all sunshine! Just before end of financial year, I decided to heavily reduce my short positions in two ASX stocks. These two positions were in deep-red for a fair while now and I just could not let go of it for a long time but I had to! I also did few mistakes trading US options market and lost some. Finally, I have honed in on one strategy specifically for the US market, hopefully, it will be profitable and stick with it.
Earlier in this blog, I mentioned about tracking towards our goal. Our goal is/was always pretty straightforward,
Our assets should help us sustain our standard of living.
If we assume, our annual living expenses is $X then we need to make sure our investment returns needs to be $X to help us sustain our standard of living. But I follow a simple rule for my networth posts and that is I do not put an absolute $ figure in any of them. Therefore, tracking the goal our way is not possible on this blog.
And I could not think of a simpler way to present this goal on a blog and then track it such that it is in some way useful to readers (aka universal). Also, $ figures are very subjective to everyones abilities and circumstances. One, everyone’s lifestyle is different therefore living expenses will differ a lot. Two, the way I might extract investment returns will not be the same as someone reading the blog. I might need a principal of $4M to eek out 1.25% (approx. $50K) per annum but someone else might achieve 2.5% return and would only need $2M capital!
Recently, I came across AussieFireBug recent blog, where he presents the idea of tracking his FIRE goal by tracking monthly expenses vs monthly 4% withdrawal rate from the portfolio. After a bit of reading/googling, I realised 4% withdrawal rate is considered as ‘gold standard’ in retirement circles. So, now I have something that I can present that will be universal to everyone.
Aussie FireBug uses absolute $ figures. I do not think absolute $ figures will be suitable because of those two factors that I previously highlighted i.e. everyones lifestyle is different, everyones ability to extract returns is also different, etc. Therefore, I have implemented a small tweak to that, whereby I am tracking the ratio between monthly expenses and monthly 4% withdrawal rate. I call this “Self Sustenance Ratio”. If the ratio breaches 100% then we are “self-sustainable” if not then we know how much more we need to achieve. So, heres our chart.
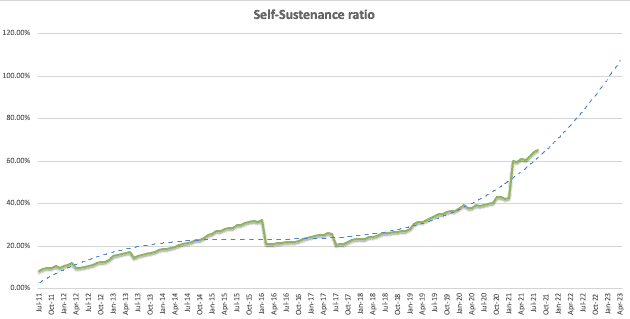
As of today, our Self-Sustenance ratio is at around 65% i.e. monthly 4% withdrawal rate will fund 65% of our current lifestyle. I have also plotted a simple non-linear curve that forecasts that, if we maintain the current rate, we will achieve 100% self-sustenance by August 2023. At some point in the near future, we intend to buy our principal place of residence therefore August 2023 will get blown out to of the ball park for sure. Nevertheless, having goals and tracking them is always helpful.
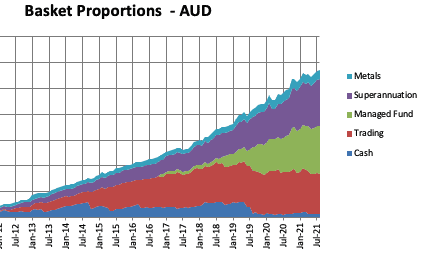
Just for reference, our portfolio consists of,